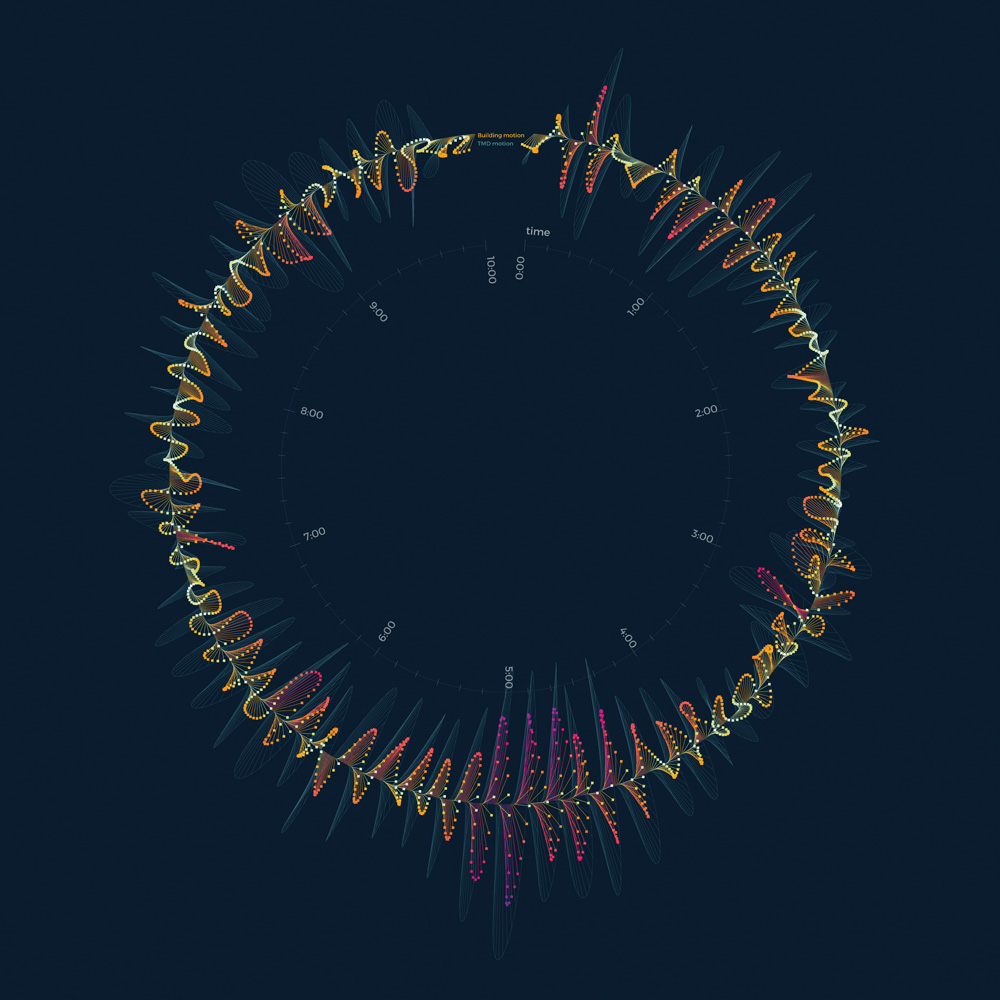
This visualization shows an engineering simulation of the movement of a supertall building and its tuned mass damper during a windstorm. Time is arrayed along the radial axis. The bright, coloured lines show the building’s motion, while the fainter blue lines show the damper’s motion. This image conveys a lot of information, but is intuitive to read, and even beautiful. Like so much of our work, it finds the simplicity on the other side of complexity. That’s why we like it.